

by Carl Kitchen
BP releases “striking” data
BP has released its latest World Energy Review[i], which for the first time includes data on the fuel mix in the global power sector. It points to what it describes as both the most striking and worrying aspect of this data, specifically the trends in the fuel mix over the past 20 years and the consistent share of coal-fired generation in the energy mix.
The data is striking, the review notes, because “despite the extraordinary growth in renewables in recent years, and the huge policy efforts to encourage a shift away from coal into cleaner, lower carbon fuels, there has been almost no improvement in the power sector fuel mix”. Worrying, it writes, because “the power sector is the single most important source of carbon emissions from energy consumption, accounting for over a third of those emissions in 2017”.
Coal’s share in the power sector fuel mix in 1998 was 38 per cent, and is exactly the same in 2017, according to the review. BP notes that despite a slight edging down in coal use for power generation in recent years, this simply reversed the drift up in coal generation in the 2000s, which was associated with China’s rapid expansion in its generation fleet.
While last year coal’s share of power generation fell 3.1 per cent, it remains the dominant source for electricity generation globally, and accounts for almost as much generation as natural gas (23.2 per cent) and hydroelectricity (15.9 per cent) combined.
Figure 1 shows that while there has been an increase in the percentage of non-fossil fuel generation, the use of coal-fired generators in the overall mix has been consistent.
Figure 1: Fuel Shares in Power Generation (%)
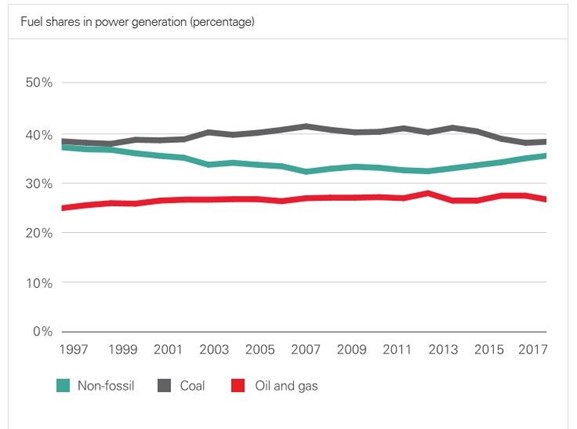
Source: BP Statistical Review of World Energy
As shown above the share of non-fossil fuel generation is slightly lower than 20 years ago, and this reflects the fact that the growth of renewables has not yet compensated for the loss of nuclear generation capacity around the world.
Renewables share of generation – excluding hydroelectricity - was 8.4 per cent. It has grown by 6.1 per cent since 2007, while nuclear power generation’s share has fallen by 3.4 per cent in that same time.
Figure 2 shows a more detailed breakdown by generation fuel type since 1985 and illustrates the growth trends in renewables and gas generation in recent years, as well as the decline in nuclear generation, slight decline in generation from hydro and the fairly consistent share of coal-fired generation globally.
Figure 2: Share of global electricity generation by fuel (%)
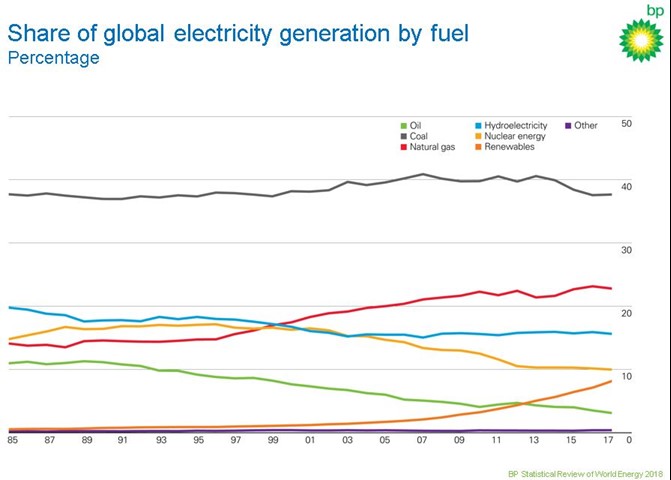
Source: BP Statistical Review of World Energy 2018
Despite high growth rates, renewable energy still represents a small fraction of today’s global energy consumption. Renewables do, however, play a significant role in the growth of electricity, and last year contributed almost 50 per cent of the growth in global power generation.
At the individual country level, BP notes that renewable sources are already playing an important role in some countries. Denmark leads the way, with 68 per cent of its power coming from renewables. Among the larger EU economies, renewables' share in power is 30 per cent in Germany, 28 per cent in the UK, 25 per cent in Spain, and 23 per cent in Italy.
Electricity Generation Growth
Overall BP found that global electricity generation increased by 2.8 per cent in 2017 which is close to its 10-year average. In terms of where this occurred, almost all of it was driven by the developing world, while in terms of generation type a big part of the increase was driven by the expansion in renewable capacity (wind up 17 per cent or 163TWh and solar up 35 per cent or 114 TWh.)
Wind and solar accounted for almost half of the total growth in power generation, while still only accounting for just over 8 per cent of total generation capacity. Coal accounted for most of the rest of the growth in generation (44 per cent).
Figure 3 shows the percentage share by fuel mix in electricity generation by regions. The strength and extent of coal-fired generation in Asia Pacific (which has been the subject of commentary in the recent policy debates locally) can be seen in the bar graph.
Figure 3: Regional electricity generation by fuel 2017 (%)
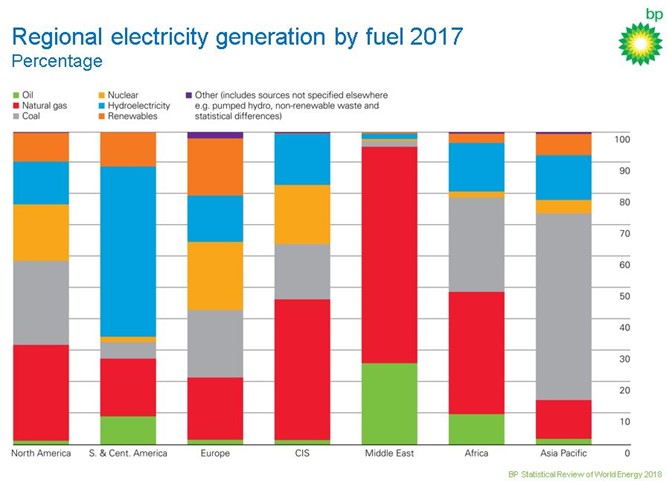
Source: BP Statistical Review of World Energy 2018
Solar, in particular, is highlighted as having made major progress – solar capacity increased nearly 100GW in 2017, and global solar generation increased by more than a third and while much of this growth is underpinned by policy settings, it has also been assisted by falling solar costs, “with auction bids of less than 5 cents/kWh… now almost common place”, according to the review.
Double Digit Growth
Global renewable power consumption increased 17 per cent, the 14th successive year of double-digit growth. Apart from accounting for nearly half the growth in global power generation in 2017, renewables also contributed 27 per cent of world primary energy growth.
The OECD remains the main source of renewable power generation (63 per cent of the world total in 2017), but non-OECD growth has accelerated sharply and has exceeded the OECD growth rate in percentage terms each year for the past 12 years.
The share of renewable power in global power generation has almost doubled in five years from 4.6 per cent in 2012. Renewables accounted for 12 per cent of OECD power generation in 2017, compared to 6 per cent in the non-OECD. While the aggregate shares remain low, for some individual countries renewables now contribute a significant share of power. Countries where renewables contribute more than 20 per cent of the power generated include: Germany, Spain, the United Kingdom, Italy, Portugal, Denmark, Finland, Ireland and New Zealand.
Solar
BP reports that solar is scaling up rapidly and that capacity has nearly quadrupled in the past five years. In 2017 new installations totalling more than 97 GW in 2017 took global solar PV power generating capacity to nearly 400 GW, a 32 per cent increase compared to the end of 2016.
The largest growth last year was recorded in China (53 GW) and the US (11 GW), and together they accounted for two-thirds of the growth in global solar capacity. Japan provided the third largest addition (7 GW).
China also leads in terms of cumulative installed capacity (130 GW), with one-third of the global total. The US (51 GW) and Japan (49 GW) are second and third with Germany (42 GW) now in fourth position.
The review notes that the solar overall share of global power generation remains low (1.7 per cent), but its share has more doubled in just three years. “Solar is starting to have a noticeable impact in terms of sources of power generation growth, contributing nearly 20 per cent of the growth of global power in 2017,” the review notes.
Figure 4: Solar PV generation capacity (gigawatts, cumulative installed capacity)
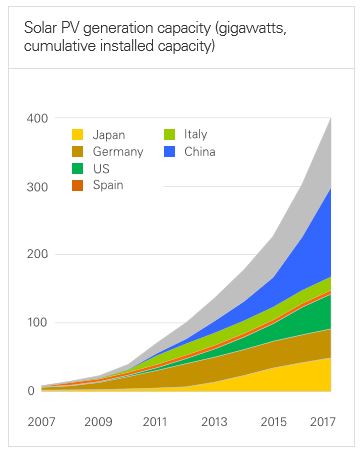
Source: BP Statistical Review of World Energy 2018
Wind
Wind power continues to grow strongly, providing 4.4 per cent of global power and last year wind generating capacity grew by 10 per cent, with capacity increasing by 47 GW to reach 515 GW by the end of the year.
Again, China leads the world in terms of installed wind capacity (164 GW), and in 2017 China recorded the largest addition of new wind capacity (15 GW), followed by the US (6 GW), Germany (6 GW), India (4 GW) and UK (4 GW).
Wind generation grew by more than 17 per cent in 2017 to reach 1120 TWh, or 4.4 per cent of total world electricity generation. That is more than the total power generation capacity of Russia, the world’s fourth largest power generator, according to the BP Review. China was the largest wind power producer last year, growing by 21 per cent and contributing 30 per cent of global growth in wind power. Despite this, wind provided just under 4 per cent of power in China.
Wind has become an important contributor to European electricity generation. In Denmark wind power provided more than 48 per cent of power generation in 2017, and wind power now provides 15 per cent or more of power generated in Ireland, Lithuania, Germany, Portugal, and Spain. Wind has a much smaller share in the US, where it contributed just under 6 per cent of power generation in 2017.
Figure 5: Installed wind generation capacity (gigawatts, cumulative installed capacity)
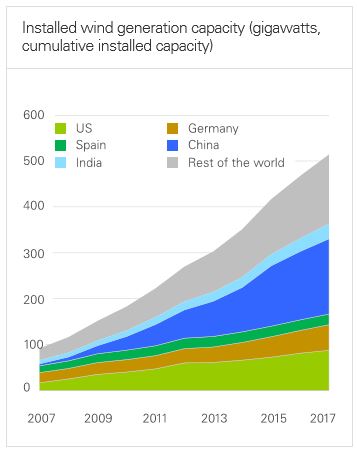
Source: BP Statistical Review of World Energy 2018
Geothermal
Geothermal capacity grew by 4.3 per cent (600 MW) in 2017, to reach 14.3 GW. The largest additions to capacity were in Turkey (243 MW) and Indonesia (220 MW). The US has the largest geothermal capacity with 3.7 GW (26% of the world total), followed by the Philippines (1.9 GW), Indonesia (1.9 GW) and New Zealand (1 GW).
Geothermal power runs at a much higher load factor than wind or solar (its energy source is continuous rather than intermittent), so geothermal produces significantly more electricity per megawatt of capacity. However the geological conditions required for geothermal power mean that development has been concentrated in a relatively small number of countries.
Geothermal power generation grew by 3.1 per cent in 2017. Overall the geothermal share of global power generation remains very small (0.3 per cent), but in certain countries it plays a significant role, for example, in Kenya it is more than 40 per cent of power generation, Iceland (more than 25 per cent), and New Zealand (18 per cent).
Hydroelectricity
World hydroelectric power generation rose by 5 million tonnes of oil equivalent (MTOE), just 0.9 per cent, compared with the 10-year average of 2.9 per cent
The US (7 mtoe) saw the largest growth. China’s growth was the slowest since 2011, while European output declined by 10.5 per cent (-16 mtoe).
Figure 6: Hydro consumption by region (MTOE)
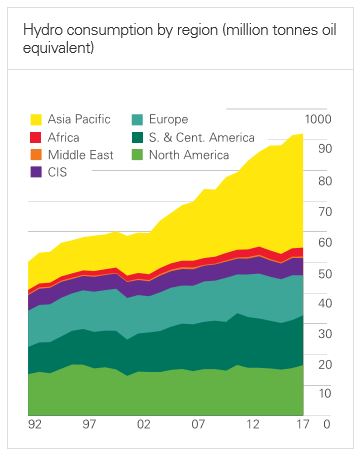
Source: BP Statistical Review of World Energy 2018
Nuclear
Global nuclear generation rose by 5 million tonnes of oil equivalent (mtoe), or 1.1 per cent, above the 10-year average growth rate of -0.7 per cent.
Growth in China (8 mtoe) and Japan (3 mtoe) was partially offset by declines in Europe (3 mtoe).
Figure 7: Nuclear energy consumption by region (MTOE)
![]()
Source: BP Statistical Review of World Energy 2018
[i] https://www.bp.com/en/global/corporate/energy-economics/statistical-review-of-world-energy/hydroelectricity.html
Send an email with your question or comment, and include your name and a short message and we'll get back to you shortly.